Showing posts with label visualization. Show all posts
Showing posts with label visualization. Show all posts
Sunday, June 30, 2013
E-Book Pick of the Month
If you want to learn more about charts and illustrating data, Data Points: Visualization That Means Something by Nathan Yau, is a standout book that we highly recommend. It focuses on the graphics side of data analysis and offers a new perspective on visualization. This will enhance and complement your understanding of what you already knew about charts. (Available in both Kindle and trade paper)

Wednesday, June 19, 2013
False Scaling
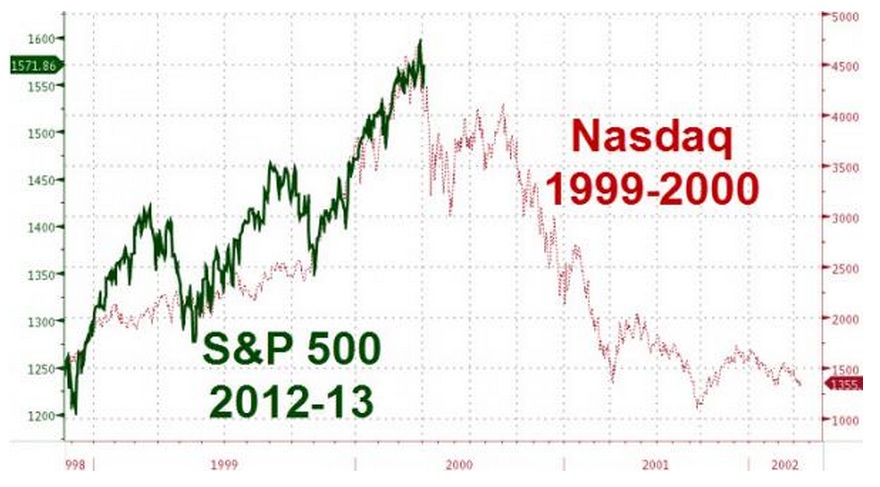
Photo Courtesy of Thereformedbroker.com
Sneaky way that improperly “scaling”
charts can give you the perception of what possible outcome has for the
near future. It creates an air of
uncertainty and fear. www.thereformedbroker.com/2013/05/03/lying-with-charts/
Saturday, June 15, 2013
Many of Today’s Graphs Do Not Reflect the Truth of Inflation

Graph Courtesy
of Shadow Stats
Want to know why
your food, fuel and products are going up while your salary is not keeping pace? All while some consumer products, such
as computers, phones and other techie items seem to be going down in price? Despite the popular belief that inflation is low, it may be actually driving up the cost of living. Are government numbers not to be trusted? Over the years, politicians and accountants
began to omit certain data criteria from their charts (for example, the M3, or
monetary supply), so their graphs tend to discount inflation. Instead, these charts
will show you today's truth in terms of how inflation was calculated using the old criteria. www.shadowstats.com/alternate_data/inflation-charts
Monday, June 10, 2013
Do You Know the Real Purpose of Graphics in Your Proposal?

Photo Courtesy
of www.helpeverybodyeveryday.com
Wednesday, May 20, 2009
Getting Started

If you found your way here, you probably know that my book How to Lie with Charts is now in its Second Edition and has been adopted for coursework at institutions such as Empire State and Georgetown Public Policy Institute.
(Available from Amazon.com, Baker & Taylor, Booksurge, and other booksellers.)
In June of 2009 (next month as I write this) I will be giving the keynote presentation on this topic to an Operational Excellence conference in San Francisco. We're going to have great fun while I gently help these managers learn to mistrust everything they see in business slides, including their own.
And -- just the cure for post-meltdown bewilderment -- I'm preparing a new edition for release this fall: How to Lie with Charts: Investors' Edition.
There will be more about this edition -- which is aimed specifically at financial analysts and business managers -- on these pages in the days to come. So please consider adding this blog to your regular feeds so you can get all the updates -- and puh-lese post your questions, quibbles, and quantitative musings to the discussion threads.
Feel free to comment on any post to pose a query about the book or about the fascinating topic of visualizing numeric results. And if there's something you want to see in the new edition, there's still time to suggest it.
In June of 2009 (next month as I write this) I will be giving the keynote presentation on this topic to an Operational Excellence conference in San Francisco. We're going to have great fun while I gently help these managers learn to mistrust everything they see in business slides, including their own.
And -- just the cure for post-meltdown bewilderment -- I'm preparing a new edition for release this fall: How to Lie with Charts: Investors' Edition.
There will be more about this edition -- which is aimed specifically at financial analysts and business managers -- on these pages in the days to come. So please consider adding this blog to your regular feeds so you can get all the updates -- and puh-lese post your questions, quibbles, and quantitative musings to the discussion threads.
Feel free to comment on any post to pose a query about the book or about the fascinating topic of visualizing numeric results. And if there's something you want to see in the new edition, there's still time to suggest it.
Subscribe to:
Posts (Atom)