Sunday, June 30, 2013
E-Book Pick of the Month
If you want to learn more about charts and illustrating data, Data Points: Visualization That Means Something by Nathan Yau, is a standout book that we highly recommend. It focuses on the graphics side of data analysis and offers a new perspective on visualization. This will enhance and complement your understanding of what you already knew about charts. (Available in both Kindle and trade paper)
Tuesday, June 25, 2013
Pay Attention and Learn the Difference Between Mean and Median When Reading Charts
 | ||||
| Median Net Wealth |
 | |||
| Home Ownership |
 | |
| Mean/Median |
Photos by Zerohedge
Median can sometimes paint a different picture than the mean. The median marks the place in the data set where values cluster. The mean is the arithmetic average. You can cry poor using one tactic
or the other as Germany tried to do in these charts. Skewing results by picking the data reduction method is a way to paint a picture of the
chartist's desire!
Wednesday, June 19, 2013
False Scaling
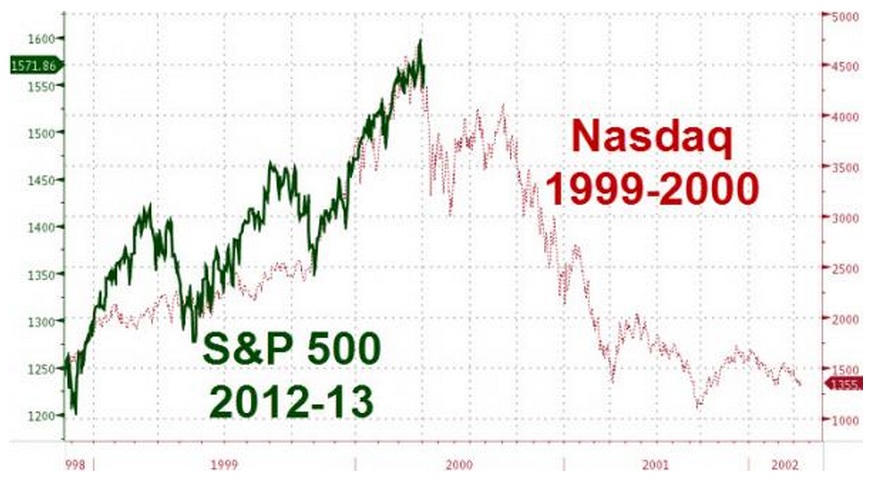
Photo Courtesy of Thereformedbroker.com
Sneaky way that improperly “scaling”
charts can give you the perception of what possible outcome has for the
near future. It creates an air of
uncertainty and fear. www.thereformedbroker.com/2013/05/03/lying-with-charts/
Saturday, June 15, 2013
Many of Today’s Graphs Do Not Reflect the Truth of Inflation

Graph Courtesy
of Shadow Stats
Want to know why
your food, fuel and products are going up while your salary is not keeping pace? All while some consumer products, such
as computers, phones and other techie items seem to be going down in price? Despite the popular belief that inflation is low, it may be actually driving up the cost of living. Are government numbers not to be trusted? Over the years, politicians and accountants
began to omit certain data criteria from their charts (for example, the M3, or
monetary supply), so their graphs tend to discount inflation. Instead, these charts
will show you today's truth in terms of how inflation was calculated using the old criteria. www.shadowstats.com/alternate_data/inflation-charts
Monday, June 10, 2013
Do You Know the Real Purpose of Graphics in Your Proposal?

Photo Courtesy
of www.helpeverybodyeveryday.com
Subscribe to:
Posts (Atom)